The Average Person Who Never Existed
A useful summary became an imagined human norm—and sometimes a design, medical and administrative trap.
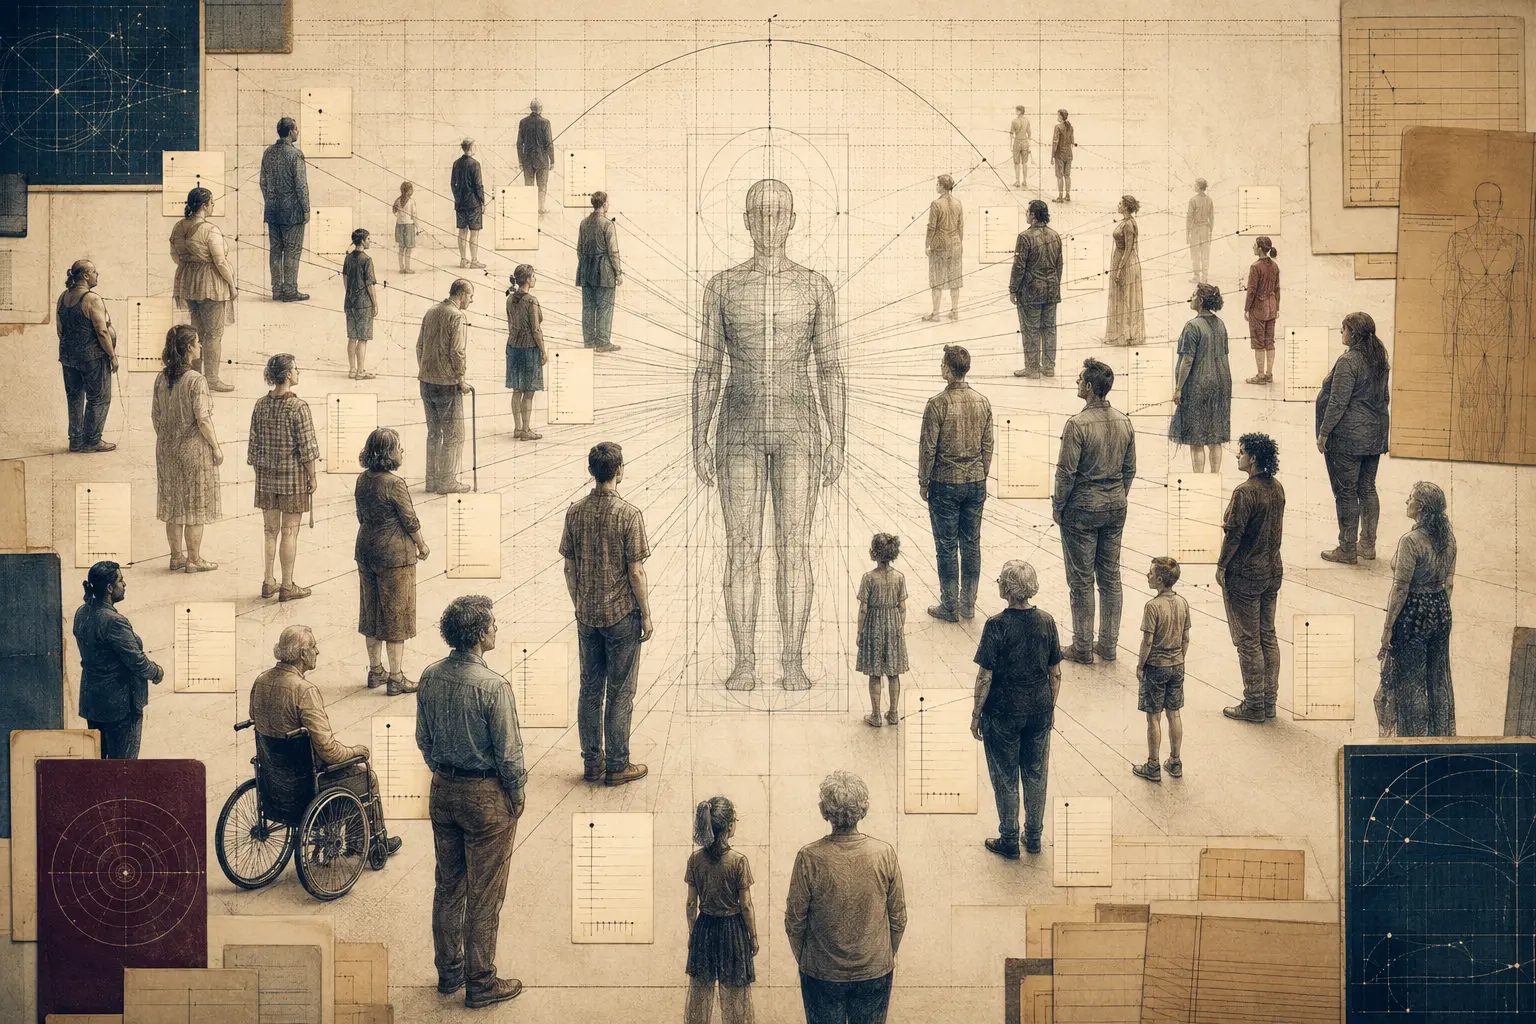
The average reveals patterns across a population—but describes no single person. Then and Therefore Editorial Team. Conceptual editorial image generated for this article; it is not documentary evidence.
Quetelet adapted astronomical error thinking to social data and developed the ambiguous idea of the ‘average man’.
Why This Matters
Nobody has 2.3 children. No pilot has an average-sized body in every dimension. No patient is the mean of every measurement in a medical table.
And yet averages govern real decisions. They shape budgets, product designs, clinical reference ranges, school comparisons and public arguments. The arithmetic mean is indispensable because it compresses many observations into one understandable value. Trouble begins when that summary is mistaken for a person.
The nineteenth-century Belgian astronomer and statistician Adolphe Quetelet helped move the techniques used to analyze repeated measurements into the study of human populations. His *l’homme moyen*—the “average man”—was more than a calculation. At different moments it appeared as a social type, a center around which traits varied and even an ideal.
That move made populations newly describable. It also encouraged institutions to treat variation as deviation from a norm. The average person became powerful precisely because no such complete person had to exist.
Astronomers faced a practical problem: repeated observations of the same object did not produce exactly the same result. Instruments differed, observers erred and atmospheric conditions changed. By studying the distribution of errors, mathematicians could estimate the most plausible underlying value.
The bell-shaped error curve later associated with the normal distribution emerged from work by Abraham de Moivre, Pierre-Simon Laplace, Carl Friedrich Gauss and others. In astronomy and geodesy, the model concerned repeated measurements of one presumed quantity. Deviations could be treated as errors around a true value.
Quetelet made a consequential transfer. What if measurements across different people could be analyzed in a similar way? He collected and examined data on height, weight, births, deaths, crime and other social phenomena. In his 1835 work on social physics, regularities at the population level seemed to reveal patterns hidden by individual variation.
The transfer was productive but not neutral. Measurements of one star differ because observations are imperfect. Human beings differ because they are actually different. Applying the same curve can encourage the observer to treat diversity as error around a preferred type.
Quetelet did not use “average man” in one perfectly consistent sense. Historical scholarship shows that the concept could describe a statistical center, a representative type or a kind of ideal. This ambiguity helped it travel. Administrators could use averages pragmatically while reformers, physicians and social theorists attached stronger claims about normality.
The distinction between descriptive and normative averages then blurred. A descriptive statement says the mean height in a defined sample is a certain value. A normative statement says bodies near that value are proper, healthy or suitable. The first may support analysis. The second requires additional evidence and a moral judgment, whether acknowledged or not.
Statistics entered government alongside censuses, public health records, military recruitment and insurance. Population averages helped compare places and periods. They could reveal falling mortality or unequal disease burden. But the chosen population mattered. A reference based mainly on adult men, soldiers, white populations or those who reached a clinic could become a standard applied to everyone.
Design created a particularly vivid problem. Engineers often needed a representative human body for seats, controls, clothing and workspaces. Using a few average dimensions seemed rational. But dimensions do not line up neatly within individuals. A person near the average in height may be far from the average in arm length, shoulder width or seated reach.
The lesson was demonstrated dramatically in twentieth-century aviation research. Analyses of pilots showed that almost nobody was average across a set of body dimensions simultaneously. Cockpits designed around a composite mean could fit the fictional average better than the real people expected to operate them. Adjustable seats and controls were not concessions to abnormality; they were better engineering.
Medicine carries a related tension. Reference ranges summarize distributions in selected populations. They help identify results worth investigating. But “outside the range” does not automatically mean ill, and “inside” does not guarantee health. Age, sex, ancestry, pregnancy, environment, medication and measurement method can all matter. The range is a tool for judgment, not judgment itself.
Population summaries improved comparison but could turn descriptive centers into normative standards that fit few actual people.
Therefore
The average became one of modern administration’s favorite instruments because it allows comparison. A city can track average life expectancy. A school system can compare mean scores. An employer can estimate typical handling time. A country can report income per person.
Every such number answers a specific question while hiding others. Mean income can rise because the top gains sharply even if the median household does not. Average test performance can conceal widening gaps. Mean response time can look acceptable while a minority of emergencies waits dangerously long.
The correct response is not to reject averages. It is to ask what distribution sits behind them. Median, percentiles, variance and subgroup results often reveal patterns the mean cannot. Averages are strongest when presented as one view among several.
The fictional average also affects identity. When institutions repeatedly display one body, household or life course as typical, people outside it can experience their ordinary variation as personal failure. A statistical center quietly becomes a social center.
This is especially risky when historical datasets reflect unequal access. If a medical study underrepresents women or a safety test models only a limited body type, the resulting “normal” can encode the sample’s exclusions into equipment and care. The bias may appear objective because it is expressed numerically.
At the same time, population statistics can expose injustice. Comparing maternal mortality, disability access or wages across groups can make unequal outcomes visible. The problem is not classification itself. It is the unexamined leap from summary to essence.
Quetelet’s legacy is therefore double. He helped establish the idea that social patterns could be studied quantitatively. He also supplied a language through which the center of a distribution could be imagined as a person and, from there, as a standard.
Responsible systems should reveal samples and distributions, use multiple summaries and design adjustable pathways for real variation.
What Next
Modern systems can calculate far more than one mean. That does not automatically make them more humane.
Personalization algorithms may replace the average customer with thousands of predicted segments. Yet they can still reduce people to correlations and treat unusual cases as noise. A model can be highly individualized in output while remaining careless about autonomy, context and error.
Better practice begins with five questions.
What population produced the statistic? A reference is only as general as its sample.
What kind of average is being used? Mean, median and mode answer different questions.
How wide is the distribution? A center without spread can mislead.
What decision follows? A harmless summary becomes consequential when attached to eligibility, diagnosis or design.
Can the system accommodate variation? Adjustment, multiple pathways and human review often outperform a single optimized norm.
There is also a language test. Replace “the average person” with “the average of these observations in this defined population.” The sentence becomes clumsier and more honest. It reminds us that the statistic belongs to a dataset, not to a human archetype.
The average person never existed. The average remains useful. The work is to keep the first fact visible whenever the second guides power.
The statistic belongs to a defined dataset, not to a human archetype.
References
Sources are listed in Harvard author–date format. Links are provided where a stable public record is available.
- Quetelet, A. (1835) Sur l’homme et le développement de ses facultés.
- Porter, T.M. (1986) The Rise of Statistical Thinking, 1820–1900. Princeton: Princeton University Press.
- Tafreshi, D., Slaney, K.L. and Neufeld, S.D. (2022) ‘Adolphe Quetelet and the legacy of the “average man” in psychology’, History of the Human Sciences, 35(4).
- Daniels, G.S. (1952) ‘The “Average Man”?’, Wright Air Development Center technical note.
Further reading
- Quetelet, A. (1835) Sur l’homme et le développement de ses facultés.
- Porter, T.M. (1986) The Rise of Statistical Thinking, 1820–1900. Princeton: Princeton University Press.